The operations view for the people running MessageFoundry — every interface's health and throughput on one screen, the tools to trace a single message end to end, and start/stop, alerts, and replay close at hand. It reads and drives the engine through one localhost API, so what you see is exactly what the engine is doing.
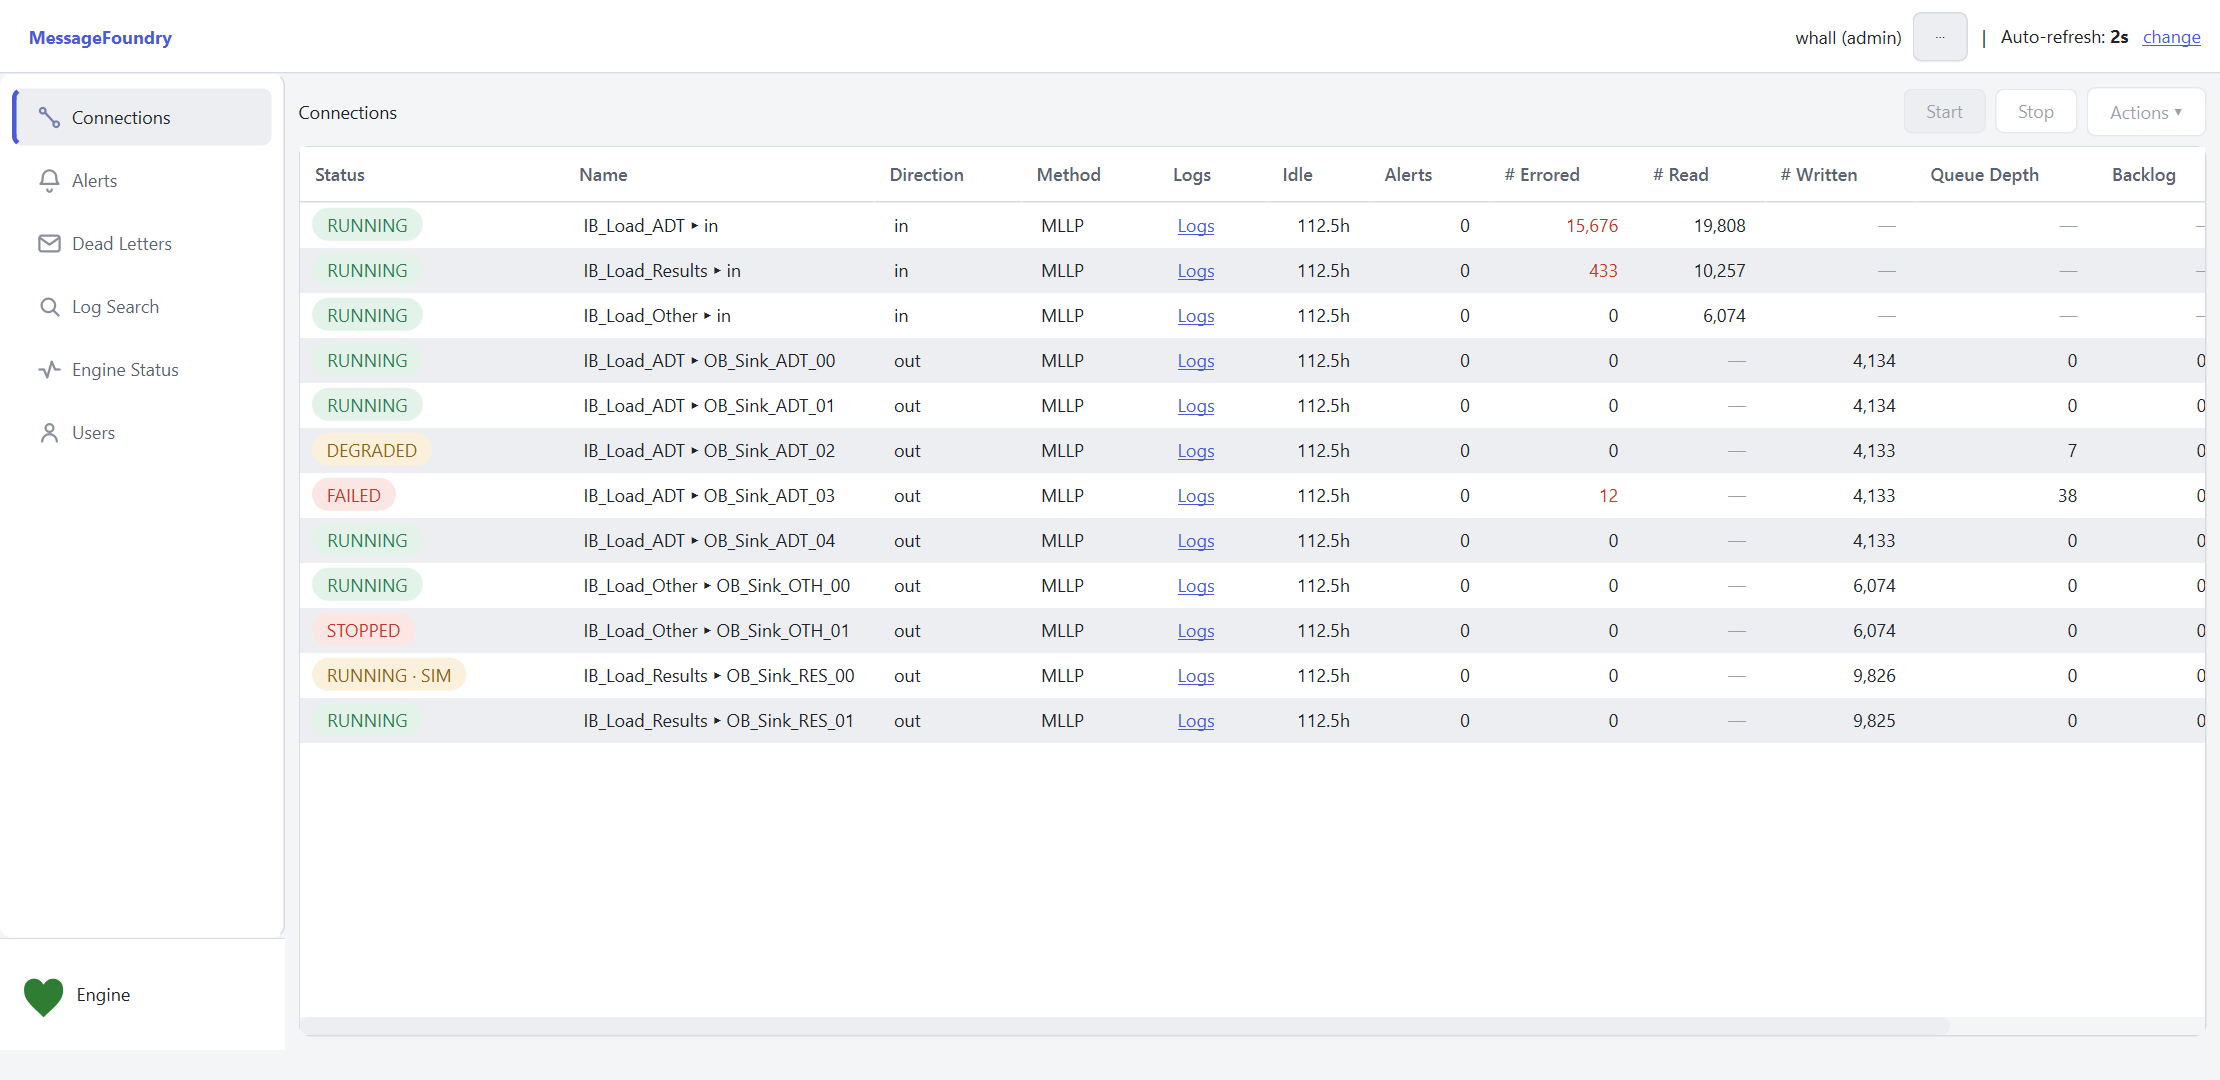
The home screen is a live table of every connection — inbound and outbound — refreshing on its own. One look tells you what's healthy, what's slow, and what's stuck.
Click into any connection's logs, or select one and start, stop, or run an action — the controls are right there, gated by your role.
SIM tag when a destination is running in simulation.From a red status to the exact message that failed, the trail is short.
A single page of the alert rules in effect and what they're watching — so the conditions that page someone are written down and visible, not buried in a config file.
Every message that exhausted its retries, in one list. Inspect why it failed and replay it with one click once the downstream is healthy again — no database surgery.
Search the log for a message, then follow it: its disposition (routed, filtered, or unrouted), its full delivery & audit trail, and an HL7 parse-tree viewer to read it field by field — with replay when you need it.
The console drives and observes the engine only through the one localhost API — it never imports the engine or touches the database directly. So authentication, RBAC, and the audit log sit at a single choke point nothing slips past.
Monitoring is read-only; actions like start/stop and replay are permission-gated. The same API powers the CLI and the VS Code editor — see how it fits together.
Run your interfaces in the open — see every message's fate, and act on it.